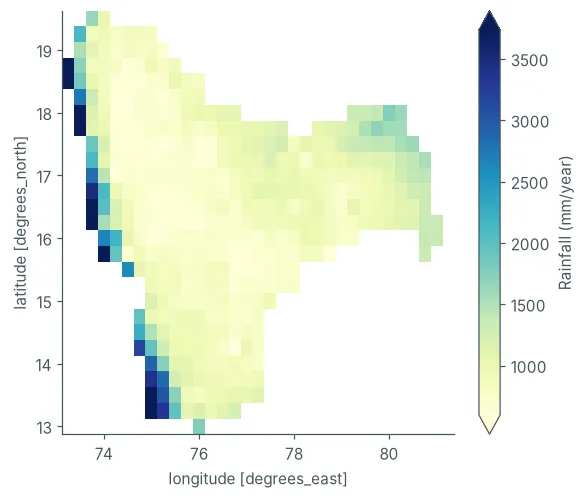
IMDLIB 0.3 adds two new features: one function to load data, and built-in regions. Together, they give daily rainfall and temperature for any state, district, river basin or city in India, as shown below with IMD data.
load()
imd.load() downloads IMD gridded data, keeps the files in a local cache and reads them when the data is first used. Loading the same period again needs no download.
import imdlib as imd

data = imd.load('rain', 2020, 2024)
tmax = imd.load('tmax', '2024-04-01', '2024-06-30') # part of a yearReal-time data
IMD also publishes provisional daily data for recent days, which source='realtime' loads.
recent = imd.load('rain', '2026-10-01', '2026-10-07', source='realtime')
recent.region(state='Kerala').round(1)| Kerala | |
|---|---|
| 2026-10-01 | 0.7 |
| 2026-10-02 | 12.7 |
| 2026-10-03 | 4.5 |
| 2026-10-04 | 4.5 |
| 2026-10-05 | 18.6 |
| 2026-10-06 | 10.0 |
| 2026-10-07 | 15.1 |
Regions
region() gives a time series for a region of India. For a state, district, basin or sub-basin, it is the area-weighted average over the shape. For a city, it is the grid cell that contains it.
maharashtra = data.region(state='Maharashtra')
pune        = data.region(district='Pune')
krishna     = data.region(basin='Krishna')
bhima       = data.region(subbasin='Bhima Upper')
mumbai = data.region(city='Mumbai')Each result is a table of daily values, with the region as its column. Here are Pune and Mumbai in early July 2024:
pune.join(mumbai).loc['2024-07-01':'2024-07-05'].round(1)| Pune (Maharashtra) | Mumbai (Maharashtra) | |
|---|---|---|
| 2024-07-01 | 7.2 | 40.3 |
| 2024-07-02 | 10.2 | 23.0 |
| 2024-07-03 | 11.0 | 5.4 |
| 2024-07-04 | 1.5 | 5.0 |
| 2024-07-05 | 4.8 | 28.5 |
Several regions at once
A list of names gives one column per region.
states = data.region(state=['Kerala', 'Maharashtra', 'Rajasthan'])monthly = states.resample('MS').sum()
monthly.groupby(monthly.index.month_name().str[:3], sort=False).mean().plot(xlabel='', ylabel='Rainfall (mm/month)');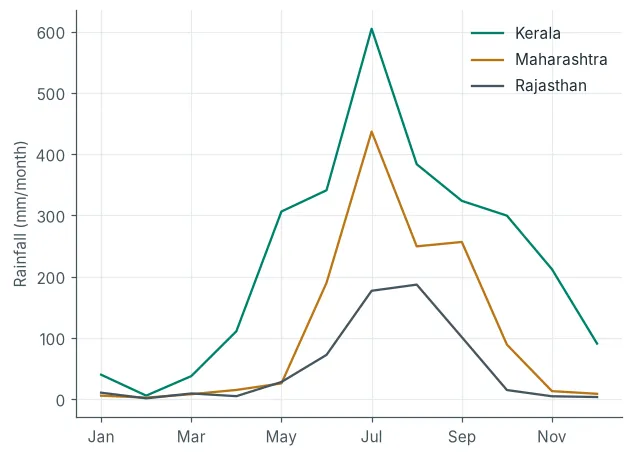
by= splits a region into its parts, here the districts of Maharashtra.
districts = data.region(state='Maharashtra', by='district')annual = districts.resample('YE').sum().mean().sort_values().rename(lambda n: n.split(' (')[0])
annual.plot.barh(figsize=(6, 9), xlabel='Rainfall (mm/year)');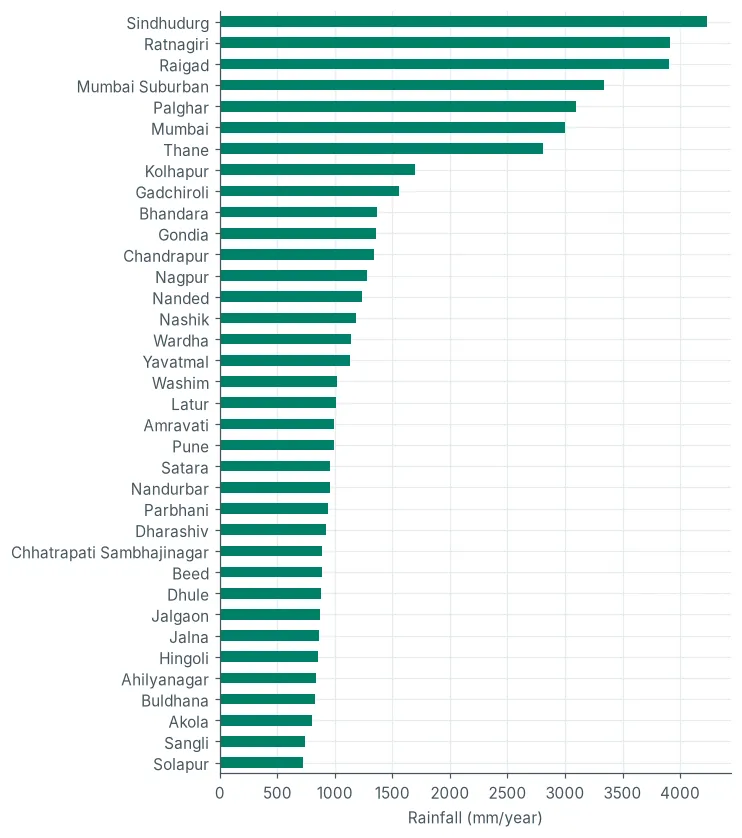
The same works for temperature. The hottest day of April to June 2024 in two cities:
tmax.region(city=['Delhi', 'Chennai']).max().round(1)Delhi (Delhi) 46.9
Chennai (Tamil Nadu) 41.4
dtype: float64Finding names
Names ignore case and accents, and old names work too.
imd.regions.search('Bombay', limit=5)| name | type | state | district | matched_alias | |
|---|---|---|---|---|---|
| 0 | Mumbai | district | Maharashtra | Bombay | |
| 1 | Mumbai | city | Maharashtra | Mumbai Suburban | Bombay |
| 2 | Mumbai Suburban | district | Maharashtra | Bombay Suburban | |
| 3 | Dharavi | city | Maharashtra | Mumbai | Bombay Dharavi |
| 4 | Ballard Estate | city | Maharashtra | Mumbai | Bombay Ballard Estate |
data.region(city='Allahabad').columns # column 'Prayagraj (Uttar Pradesh)'Index(['Prayagraj (Uttar Pradesh)'], dtype='str')Clipping
clip() returns the grid cells of one region as a new IMD object, with NaN outside.
krishna_grid = data.clip(basin='Krishna')rain = krishna_grid.get_xarray().rain
rain.resample(time='YE').sum(min_count=1).mean('time').plot(cmap='YlGnBu', size=5, aspect=1.15, robust=True, cbar_kwargs={'label': 'Rainfall (mm/year)'});